SAT & Graduation Rate Analysis
December 2025
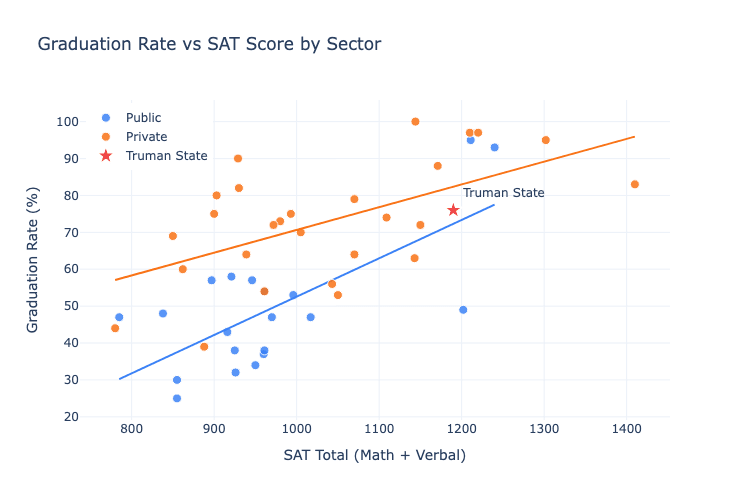
Engineered an end-to-end Python analytics pipeline (pandas, SciPy, Statsmodels) on 47 U.S. colleges — converting raw Excel into a cleaned dataset, a SQL seed script, and 7 analytical SQL queries (sector statistics, SAT band breakdowns, outperformer detection, residual analysis, and imputation sensitivity checks). Conducted comparative statistical analysis using Pearson correlation, OLS regression, and ANCOVA-style interaction modeling across 20 public and 27 private institutions; identified a significantly stronger SAT–graduation association in public schools (r=0.701, p<0.001) vs. private (r=0.572, p<0.01) with distinct slope coefficients (0.104 vs. 0.062); interaction term p=0.175 (non-significant). Built a fully reproducible analytical workflow with regression diagnostics (Residuals vs. Fitted, Q-Q plot, Cook's Distance), an interactive Plotly scatter chart with hover tooltips, a sensitivity analysis excluding imputed SAT records, and a predict_grad_rate() function with extrapolation warnings — all documented in a structured methodology writeup.
Python · SQL · NumPy · pandas · Statsmodels · SciPy · Plotly · Jupyter · Git